

Testing REST Web Services in MyEclipse with REST Inspect
Use REST Inspect (available in versions 2015 CI 14 – 2016 CI 7) to discover endpoints in your project and create test scenarios from discovered endpoints. In this tutorial you will learn to:
- View Endpoints in MyEclipse
- Open the REST Inspect Window
- Invoke an Endpoint
- View the Source Code
- Add Test Endpoints
- Use the Invocation History
Note: Rest Inspect is only available in the following versions of MyEclipse: 2015 CI 14 – 2016 CI 7.
1. View Endpoints from Explorers in MyEclipse
REST Inspect discovers all endpoints in your workspace. You can view these discovered endpoints, along with test endpoints created in REST Inspect, in both the MyEclipse Explorer view and the REST Explorer view. These endpoints also appear in the REST Inspect window.
Endpoints in the Explorers are represented by the following icons:![]() —Test endpoint created in REST Inspect
—Test endpoint created in REST Inspect![]() —DELETE method discovered endpoint
—DELETE method discovered endpoint![]() —GET method discovered endpoint
—GET method discovered endpoint![]() —POST method discovered endpoint
—POST method discovered endpoint![]() —PUT method discovered endpoint
—PUT method discovered endpoint
From MyEclipse Explorer—Expand all nodes in the REST Web Services node for the project.

View endpoints in MyEclipse ExplorerFrom REST Explorer—Expand all nodes in the REST Explorer.
Note: To open this view, select Window>Show View>Other>MyEclipse Common>REST Explorer.
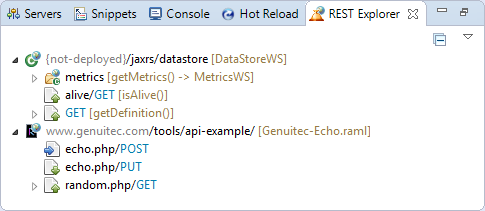
View endpoints in Rest Explorer
2. Open the REST Inspect Window
Testing REST web services is easy when you use REST Inspect. You can create test endpoints, invoke them and view an invocation history. You can open the REST Inspect window from the menu or from an endpoint.
From the menu—Select Window>Open REST Inspect.
From an endpoint—Right-click on an endpoint in the MyEclipse Explorer or REST Explorer and select Open in REST Inspect.
Tip: Double-click a test endpoint ![]() to open REST Inspect.
to open REST Inspect.
REST Inspect window
3. Invoke an Endpoint when Testing REST Web Services
Invoke a test endpoint when you want to see what the response is with a particular set of parameters. You can invoke a test endpoint from the REST Inspect window or from a test endpoint ![]() in the MyEclipse Explorer or REST Explorer. The invocation history is updated each time you invoke an endpoint.
in the MyEclipse Explorer or REST Explorer. The invocation history is updated each time you invoke an endpoint.
From the Explorer—Right-click on a test endpoint in the MyEclipse Explorer or REST Explorer and select Run in REST Inspect.
Tip: Run REST Inspect when you are actively debugging your code and want to immediately invoke the endpoint in REST Inspect, but keep the focus in MyEclipse. You can keep both windows visible and quickly view responses after making changes to your code.
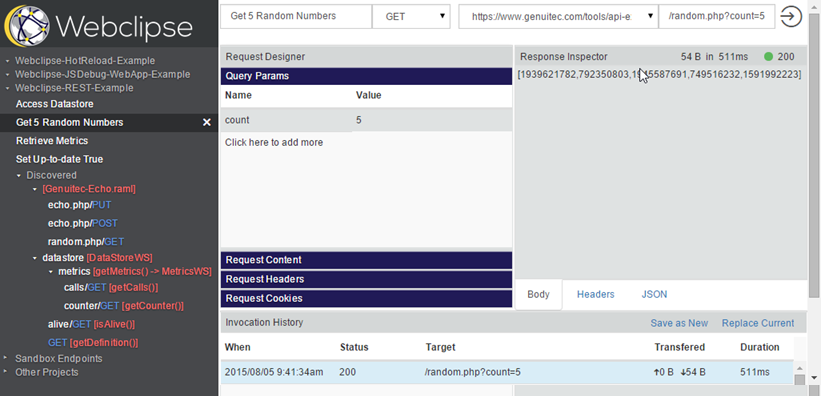
From REST Inspect—Select the endpoint and click the Invoke ![]() button. The result appears in the Response Inspector area.
button. The result appears in the Response Inspector area.
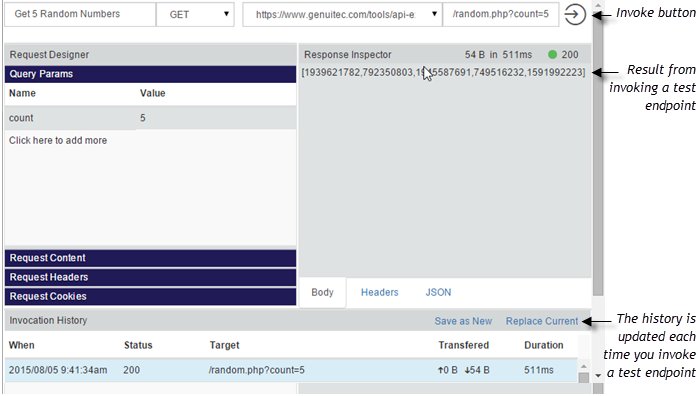
Invocation response and history in REST Inspect
4. View the Source Code
Endpoints are linked to your java code for quick access. To view the source code, double-click the endpoint in the MyEclipse Explorer or REST Explorer; or, right-click and select Show in Source. 
View source code for endpoints
View and Edit RAML Files
RAML files ![]() are listed separately in the REST Web Services node. Double-click a RAML file or endpoint to view it in the editor. The editor includes syntax coloring, default formatting and syntax validation. As you edit the file, press Enter to begin the next line with the same indent as the previous line. Press Tab to increase the indent or Shift+Tab to decrease the indent.
are listed separately in the REST Web Services node. Double-click a RAML file or endpoint to view it in the editor. The editor includes syntax coloring, default formatting and syntax validation. As you edit the file, press Enter to begin the next line with the same indent as the previous line. Press Tab to increase the indent or Shift+Tab to decrease the indent.
Save the file to update the Outline view. If the file contains errors, the first error encountered is marked ![]() in the margin of the editor. Hover over the icon for details.
in the margin of the editor. Hover over the icon for details.

View and edit RAML files with the RAML editor
5. Add Test Endpoints in REST Inspect
When you open REST Inspect, all endpoints discovered in your workspace display. You can create test endpoints from your discovered endpoints or create new ad hoc endpoints and test remote web services. These endpoints can be shared with other team members. You also have the option to add sandbox endpoints for your own testing that you do not want to share with others.
5.1 Add a Test Endpoint from Discovered Endpoints
REST Inspect lists all endpoints discovered in your workspace. This includes all JAX-RS endpoints as well as those contained in RAML files included in your project.
- Hover your mouse to the right of a discovered endpoint and click the plus sign that appears. A new endpoint appears in the list with a default name based on the discovered endpoint.
- Edit the name to describe the test endpoint. The name is updated in the endpoint list.
- The method for the discovered endpoint displays. You can select a different method: PUT, GET, POST, or DELETE.
- The server path displays. Use the drop-down if you want to select a different server.
- The path to the endpoint displays. You can edit this field directly.
Note: Any query parameters entered in the URL automatically update the Query Params section. - Complete the following sections as needed:
Query Params—You can pass query parameters to the URL. Any parameters typed in this area automatically populate the URL.
Request Content—Use this area to add data for endpoints using the PUT or POST methods.
Request Headers—Type any header information to include in the endpoint. This information provides important metadata that tells the server how to behave.
Request Cookies—Enter cookie information to define a session for the endpoint.
5.2 Add an Ad Hoc Test Endpoint
You can add new test endpoints to your project that are not based on a discovered endpoint.
- Hover your mouse to the right of your project name and click the plus sign that appears. A new Untitled endpoint appears in the list.
- Type a new name for the endpoint. The name is updated in the list.
- Select the appropriate REST supported methods: PUT, GET, POST, or DELETE.
- Type the URL for the endpoint.
- Complete the following sections as needed:
Query Params—You can pass query parameters to the URL. Any parameters typed in this area automatically populate the URL. You can also type the parameters directly from the URL field to update this area.
Request Content—Use this area when you need to add data for endpoints using PUT or POST methods.
Request Headers—Type any header information to include in the endpoint. This information provides important metadata that tells the server how to behave.
Request Cookies—Enter cookie information to define a session for the endpoint.
5.3 Add a Test Endpoint to the Sandbox
Create sandbox endpoints for your own experimentation. They only appear in your workspace and are not checked in to share with others.
- Hover your mouse to the right of SandBox Endpoints and click the plus sign that appears. A new Untitled endpoint appears in the list.
- Type a new name for the endpoint. The name is updated in the list.
- Select the appropriate REST supported methods: PUT, GET, POST, or DELETE.
- Type the URL for the endpoint.
- Complete the following sections as needed:
Query Params—You can pass query parameters to the URL. Any parameters typed in this area automatically populate the URL. You can also type the parameters directly from the URL field to update this area.
Request Content—Use this area when you need to add data for endpoints using PUT or POST methods.
Request Headers—Type any header information to include in the endpoint. This information provides important metadata that tells the server how to behave.
Request Cookies—Enter cookie information to define a session for the endpoint.
6. Use the Invocation History
Each time you invoke an endpoint in REST Inspect or when you Run a web service from the Explorer, the action is recorded in the Invocation History. You can create new endpoints based on a previous invocation and update the current state of an endpoint with the state at a previous invocation.
6.1 Create a New Endpoint from the Invocation History
- Select the endpoint.
- Select the invocation to copy from the Invocation History and click Save as New. The new endpoint appears with the same name and a prefix of “Copy of” in the endpoint list.
- Edit the name to describe the new endpoint.
6.2 Replace the Current Endpoint with a Prior Invocation
- Select the endpoint.
- Select the invocation in the Invocation History list and click Replace Current. The details for the endpoint are updated to reflect the selected invocation.
- Click the Invoke button to invoke the endpoint with the changes and add a new entry into the Invocation History.