Debugging in CodeMix
Many developers spend half of their time fixing bugs. A powerful debugger is critical to produce a quality application in a timely manner. With CodeMix, you get a robust debugging experience for a plethora of languages and frameworks, many of which Eclipse does not support.
The CodeMix plugin is compatible with Eclipse-based IDEs and tools—like MyEclipse, Spring Tools Suite, and JBoss Tools—so you can continue working in the environment you are accustomed to.
Extensions
CodeMix includes built-in debugging support for Python, JavaScript, and TypeScript. For additional debugging capabilities, extensions are required. For more on how to locate and install extensions, see Extensions in CodeMix.
The Debugger for Chrome extension is included in several extension packs (Angular, Vue, React, etc.) and adds the ability to debug web applications running in Chrome.
The PHP Debug extension, which is part of the PHP Pack, allows debugging of PHP applications.
Creating the launch.json File
To start a debugging session, right-click on your project and choose Debug As>CodeMix Launch (or, Angular Web Application, when available). This creates a launch.json file in your project, and shows you a few suggestions, allowing you to choose the type of debugging session to initiate. After selecting an option, a launchable debug configuration is created in this file. Save the file.
If the launch.json file already exists, it is opened so that you can update the file. In the configurations array, several debug configurations can be added. Invoke content assist at any time to help create additional configurations, content assist also helps with corresponding settings within particular configurations.
Starting the Debug Session
To start debugging, click the icon in the ruler area of the launch.json file for the session to initiate.

Launching a debug session from launch.json
Alternatively, open the Debug Configurations dialog, select a launch under the CodeMix node and click Debug.

Launching from Debug Configurations
There are several types of debug configurations, some run the application for you, others launch it in a browser, and some attach to already running applications. Based on your configuration, your session might break as soon as the application runs or only when a breakpoint is hit.
Stepping through Code
To add or remove a breakpoint, double click the ruler area. Breakpoints can also be disabled using the context menu or the Breakpoints view.
When execution pauses at a breakpoint, you have the following options.
Command | Button | Details |
| Step into (F5) |
| The next executable expression on the current line is invoked and execution suspends at the next executable line in the method that is invoked. |
| Step over (F6) |
| The current line is executed and execution suspends on the next executable line. |
| Step Return (F7) | Execution resumes until the next return statement in the current method is executed and execution suspends on the next executable line. | |
Suspend |
| Suspends the selected thread. |
Resume (F8) |
| Resumes a suspended thread. |
Skip All Breakpoints |
| Marks all breakpoints in the current view as skipped. |
Terminate (Ctrl+F2) |
| Stops the debugger. |
Variables
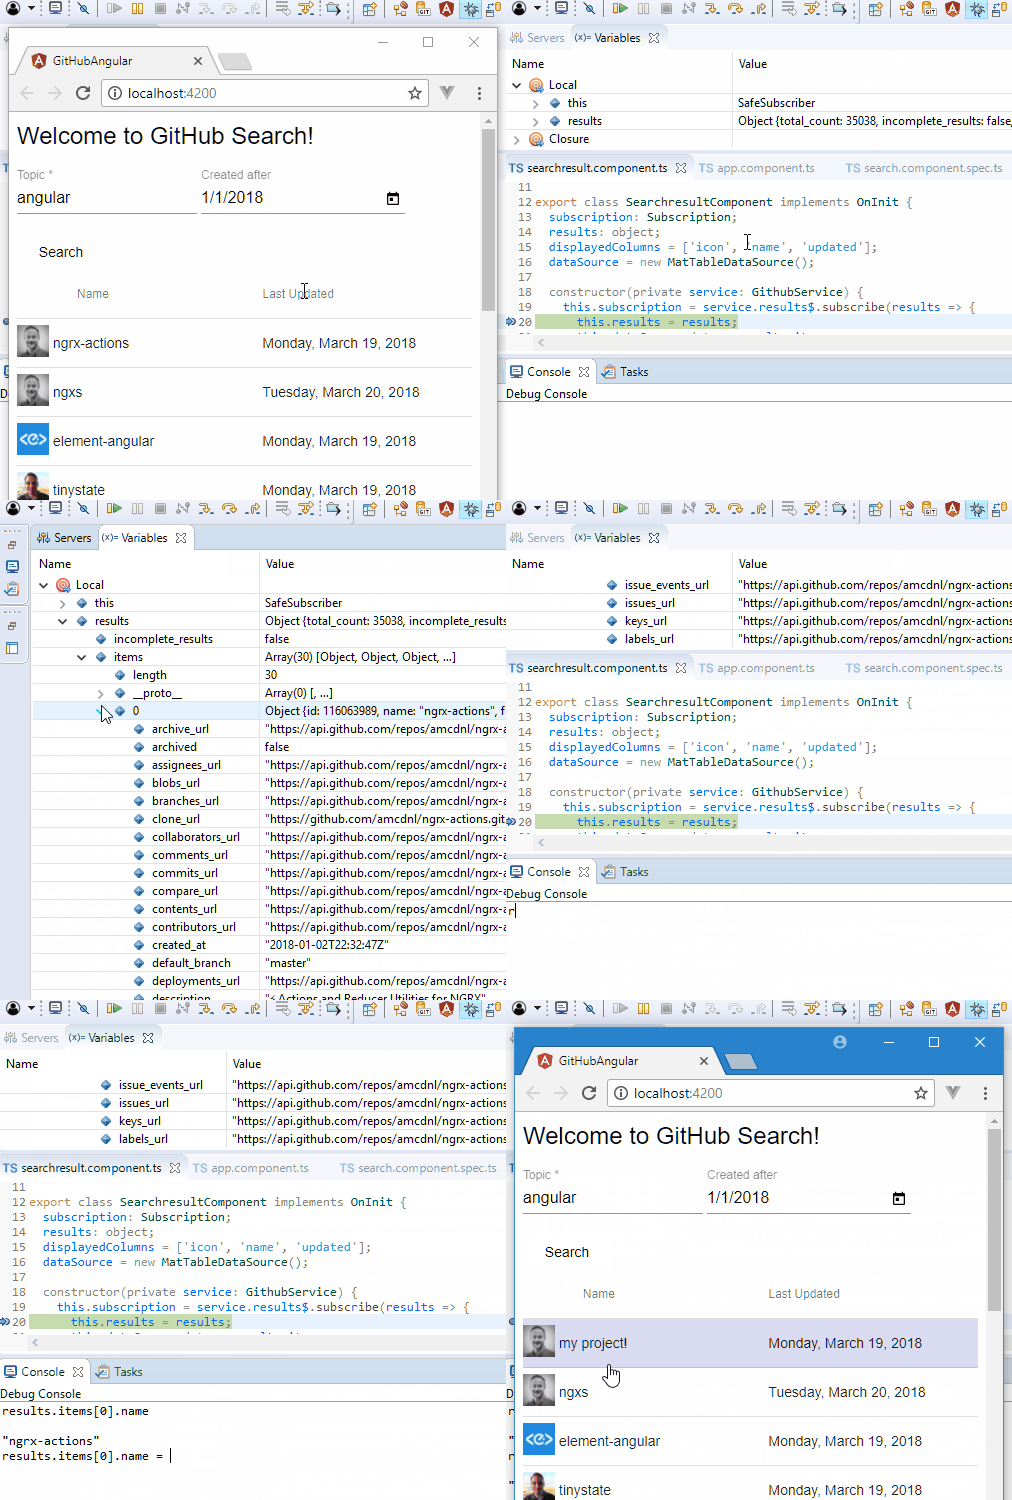
Use the Variables view to inspect or change the values of variable at the current point in time.
Debug Console
This view is automatically opened during debugging sessions, but can be manually opened using the drop down in the Console view.

Starting the Debug Console
The debug console can vastly improve your debugging experience. Use it to inspect deeply nested values, change them, or execute other snippets of code at the currently paused point.

Using the Debug Console
Changing Code
Depending on the framework being debugged, the build system, and the debug extension being used, you may be able to change your code and have these changes made live as part of the current debug session without having to restart your app or the debugging session.
For example, this support is available when debugging React applications with the Debugger for Chrome extension.


