


Did you know MyEclipse has 2-Click Deploy & Run Debugging? A lot of long-time MyEclipse users and new-MyEclipse users are very familiar with the more standard approach of first creating a deployment of their project to their configured application server, then starting up the application server, then opening a browser and navigating to their deployed application.
That's not bad, that still works just fine if that is what you want to do in MyEclipse, but if you are writing some code, and just want to fire that project up inside of MyEclipse and see it running, it's just 2-clicks away... here's how:
Let's say you have an ICEfaces project like this:
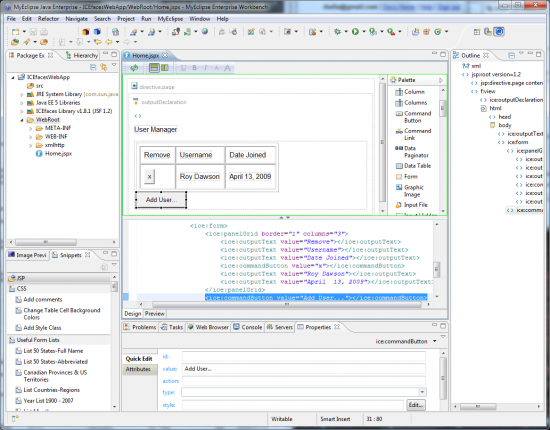
... and you want to debug it. Go ahead and set some breakpoints in your code, where ever you want to debug a portion of the app.
Now you need to deploy it to an app server and make sure it starts up in debug mode... EASY!
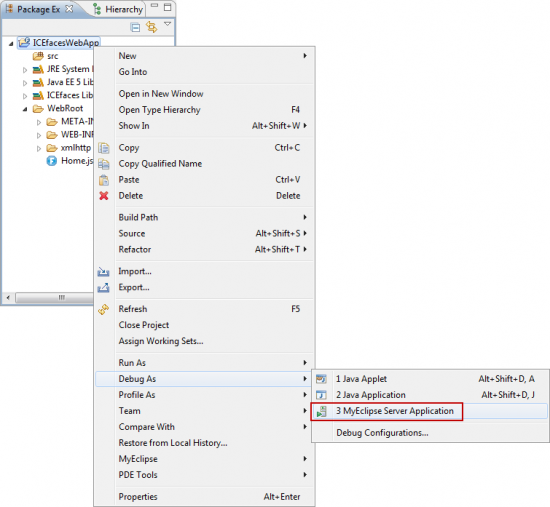
Click #1: Right-click on the project, go down to Debug As and...
Click #2: ...click MyEclipse Server Application:
What happens next are the following automatic actions for you:
- Add or Update the deployment to the selected app server in Exploded Mode
- Restart the Application Server so your changes are reloaded
- Open up a Browser view, automatically pointing at your newly deployed application
What you end up is something like this:
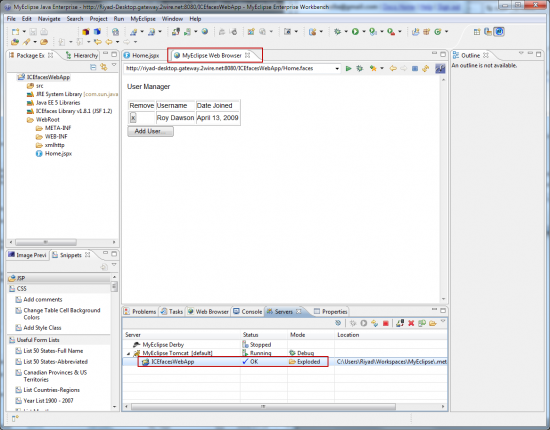
And you're done, you can click around your app, hit your breakpoints and debug everything in instant simplicity.
This is true for EAR Projects, EJB projects, Web projects or even dependent Java library projects. It's all this easy.
Happy coding!